Understanding Financial Data in Business Operations
Let’s start with the basics. Every single day, your business generates an incredible amount of financial data—more than you probably realize. From the moment a sale is made to the second an invoice is paid, the systems you use are capturing crucial numbers that could be the difference between a good decision and a game-changing one. But here’s the real kicker: it’s not the data that holds value—it’s what you do with it.
Common Financial Data Captured Daily
Imagine running a business for just one day. Here’s what you might see:
- Sales Figures – Every item sold, whether online or in-store, gets logged.
- Purchases – Inventory restocks, office supplies, you name it.
- Operational Expenses – Utilities, software subscriptions, rent.
- Employee Salaries – Payroll runs, benefits, and bonuses.
- Budgets – Forecasted spend versus what’s actually going out.
Now multiply that by 365 days a year, across departments and locations. That’s an ocean of data.
Without a system to organize and analyze this data, you’re essentially flying blind. But tools like Microsoft Dynamics 365 Business Central change that. They capture, manage, and organize all your financial inputs into a centralized hub that powers business intelligence (BI). This intelligence helps leaders make faster, more confident decisions with accurate insights.
The Role of Financial Analytics in Business Intelligence
Think of Business Intelligence as your business’s sixth sense. It connects all the dots from your raw financial data to tell a story—about profits, risks, cash flow, and more.
Here’s how financial analytics powers this:
- Pattern Recognition: It highlights trends and anomalies in revenues or costs.
- Budget vs. Actual Analysis: It compares projections with real-time numbers.
- KPI Monitoring: It tracks metrics like profitability, liquidity, and asset turnover.
For example, if your operational expenses are consistently higher than forecasted, Business Central alerts you with automated variance reports. That’s a red flag for potential budget leaks or inefficiencies you can address before they impact cash flow.
Personas in Financial Analytics
One size doesn’t fit all when it comes to financial analytics. Your CEO, finance manager, and bookkeeper might all be looking at the same numbers—but from completely different angles. That’s where Business Central’s persona-based analytics come into play.
CFOs and CEOs – Strategy at a Glance
The executive team doesn’t have time to comb through every transaction. They need the big picture—fast.
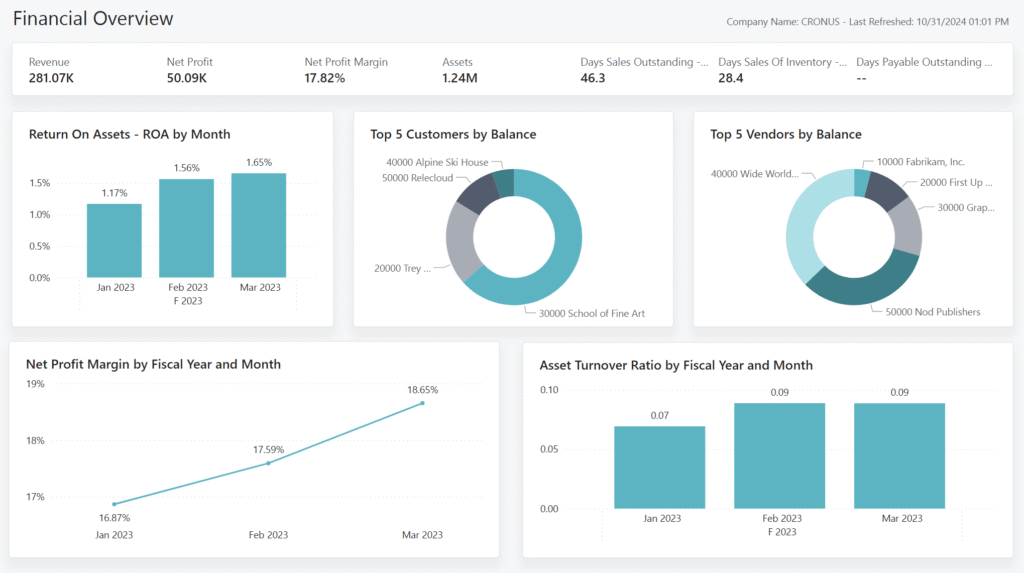
- Dashboards and KPIs: These leaders thrive on visual dashboards with KPIs like Net Profit Margin, EBIT, and Cash Flow.
- Financial Overviews: High-level snapshots of revenue, profitability, and liquidity.
- Custom Reports: Monthly and quarterly performance summaries for board meetings.
Example: A CEO notices a dip in the current ratio from 1.8 to 1.2. That’s a signal of declining liquidity. They can drill down into the Balance Sheet report to investigate further—without needing to ask the finance team.
Finance Managers – Monitoring Trends and Variances
Finance managers are the detectives of the organization. They dig deeper into numbers to spot trends and ensure everything aligns with the budget.
- Trend Analysis Reports: Comparing monthly Income Statements over time.
- Variance Analysis: Budget vs. Actual reports that flag discrepancies.
- Liquidity KPIs: Tools that track short-term financial health.
Example: A finance manager uses the Power BI Budget Comparison report to find that marketing costs spiked by 20% in Q2. After drilling down, they discover a delayed payment from a major campaign vendor.
Bookkeepers – Operational Details and Reporting Needs
Bookkeepers are the backbone of financial operations. They need tools that show real-time, line-by-line entries.
- Operational Reports: General Ledger entries, aged receivables, and vendor ledgers.
- Task Management: Alerts for overdue payments or upcoming bills.
- On-Screen Data Access: Quick views of specific accounts and transactions.
Example: A bookkeeper notices that a key customer has several invoices aged over 60 days. They use the Aged Receivables (Back Dating) report to categorize and follow up on overdue amounts.
Power BI for Financial Insights
When it comes to advanced visualization and reporting, Power BI and Business Central are a match made in financial heaven. They make complex data digestible with vibrant visuals and intuitive dashboards.
Key Financial KPIs You Should Track
Here are the heavy hitters when it comes to financial health metrics:
- Net Profit Margin: How much profit you’re making for every dollar earned.
- Gross Profit Margin: How well you manage production costs.
- Current Ratio: Can you pay off your short-term liabilities with short-term assets?
- Debt-to-Equity Ratio: How leveraged your company is.
- EBITDA: Earnings before interest, taxes, depreciation, and amortization.
These KPIs are more than just numbers—they’re your business’s report card.
Exploring the Power BI Finance App
Business Central’s Power BI Finance app features pre-built reports that offer deep insights into different financial areas. Here’s a breakdown:
- Income Statement by Month: See revenue, cost, and net income trends.
- Balance Sheet by Month: Compare asset and liability changes over time.
- Budget Comparison: Pinpoint where spending veers off course.
- Liquidity KPIs: Track ratios like cash and quick ratios.
- Profitability Report: Measure gross and net margins in one view.
- Liabilities Report: Monitor loan and debt positions over time.
- EBITDA Report: Understand operational profitability before non-core costs.
- Average Collection Period: See how efficiently you’re collecting receivables.
Example: The Profitability report reveals a consistent drop in net margins for three months. The CFO can cross-check operational costs to uncover rising supplier expenses as the cause.
Using Visual Dashboards for Decision Making
Power BI lets you create custom dashboards that are tailored to individual roles. For example:
- Executives get a clean dashboard with key KPIs and YoY trends.
- Finance managers see cash flow, departmental budgets, and overdue receivables.
- Controllers dive into journal entries and balance sheet ratios.
And since these dashboards are interactive, clicking on a KPI takes you straight to the data behind it.
Financial Reporting in Business Central
Financial reporting is where data transforms into action. With Business Central, you can create, customize, and share financial statements that meet internal and external needs.
Creating and Customizing Financial Reports
You can easily build reports for:
- Income Statements
- Balance Sheets
- Cash Flow Statements
- KPI Snapshots
Even better? These reports can be customized using your Chart of Accounts (COA), and then displayed right on your home dashboard.
Example: A company wants to build a custom report that shows Sales Revenue vs. Marketing Spend by department. They create it in minutes using predefined layouts and filters.
Leveraging Dimensions for Data Segmentation
Dimensions are like tags you apply to data entries—things like “Product A”, “Region West”, or “Salesperson: John.” Instead of cluttering your general ledger with multiple accounts, you use dimensions to slice and dice the data for analysis.
Benefits include:
- Clean, lean Chart of Accounts
- Easy comparison between products, departments, or locations
- Filterable, customizable reports
Example: You’re analyzing sales across two regions. Instead of setting up two separate sales accounts, you just filter your Income Statement by Region Dimension.
Statistical Accounts – Bridging Quantitative Gaps
Business Central also supports non-transactional data through statistical accounts. These are used to track metrics like:
- Employee headcount
- Square footage of office space
- Number of active clients
You can integrate these into your financial reports to give context to numbers. For example, showing Revenue per Employee by dividing total revenue by the statistical count of employees.